Monday 22 February 2016

Building a basic stock trading system with Drools (I)

Introduction

In my previous post, I explained how can we calculate a number of indicators based on Stock prices and that, the value on those indicators is better exploited in algorithms rather that just plotted in charts. What kind of algorithm might that be?

I mentioned that one possibility is that each indicator has a "voice" or "opinion" and that the output of the algorithm is the sum of all those opinions, some sort of consensus. Then we can translate that consensus in actual actions: Buy and Sell orders.

How can we model those opinions? Basically, they are rules responding to certain mathematical expressions. One option to evaluate is a Java-based rule engine: Drools.

But first, take a look at the result of our calculations, so you can understand better. This graph shows a "score" given by our system on how bullish or bearish (that is, whether it has an upward/downward chance) a stock is. This score is calculated using simple indicators (Simple Moving Average, New MAX, New Min, etc.)
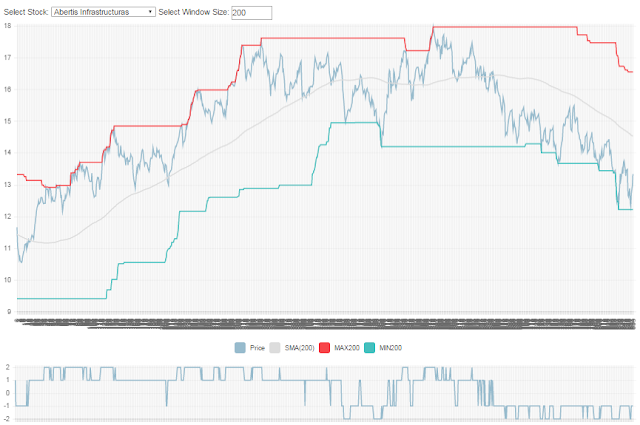
The price and indicators above, the SCORE indicator below

In this case, the rules said:

  • + 1 when the price is over the SMA(200).
  • + 1 when the price is making new MAX taking into account the last 200 days.
  • -1 when the price is under the SMA(200).
  • - 1 when the price is making new MIN taking into account the last 200 days.

So we can extrapolate that:

  • If the score was negative, and it has become positive; it´s likely for the price to go up.
  • If the score was +1 and becomes +2, it gets even better.
On the other hand:

  • If the score becomes negative or makes new lows, it´s time to close our position and avoid more losses (see right part of the graph).

Note: Please keep in mind that the main purpose here is learning the technology and have fun, don´t expect Warren-Buffet-like returns!

Sunday 14 February 2016

Calculating and showing stock indicators with Spark & AngularJS

Summary

In a previous post, I showed how simple is to calculate a SMA (Simple Moving Average) indicator from your list of stock quotations. Today, let´s see how can we modify the code to calculate multiple indicators at once (for the moment, I could not implement it using several different sliding windows at once).

Also, let´s introduce a quick prototype coded in AngularJS in order to show the different indicators in a chart with the possibility of switching stocks and windows sizes live. This is just a debug feature as our aim is to use the indicators in our future home-made analysis algorithm.

Note: If you don´t know what SMAs are, you should read this before.

Live example?

This is much easier to understand if you see an actual example running, but unfortunately I'm having problems injecting an iframe here that shows the content properly. Instead, you can clone the repository and run the application with the test files included in it:
git clone https://github.com/victor-ferrer/sparkker
Note: The application requires a Java 8 JRE installed in your machine. Also, the JAR file is rather heavy as Spring Boot adds an embedded Tomcat Server and all the Spark dependencies...

Here is a screenshot of the application that will be accessible at http://localhost:8988/#/indicators

Chart showing the upward trend followed by one stock.
The different lines are the indicators calculated on a 200 days window.

Thursday 4 February 2016

Video: Lambda architecture with Spring XD and Spark

Summary


Today I do not have any piece of code worth showing you. Instead, I would like to quickly comment on this YouTube video, which I have seen recently, that is coming from one the SpringOne2GX 2015 event (and later released to the public).


Note: The fact the these talks are published more and more often (like what happens with the DockerCon talks) kinda puts me off from paying the high premium involved in physically assisting to these events...